
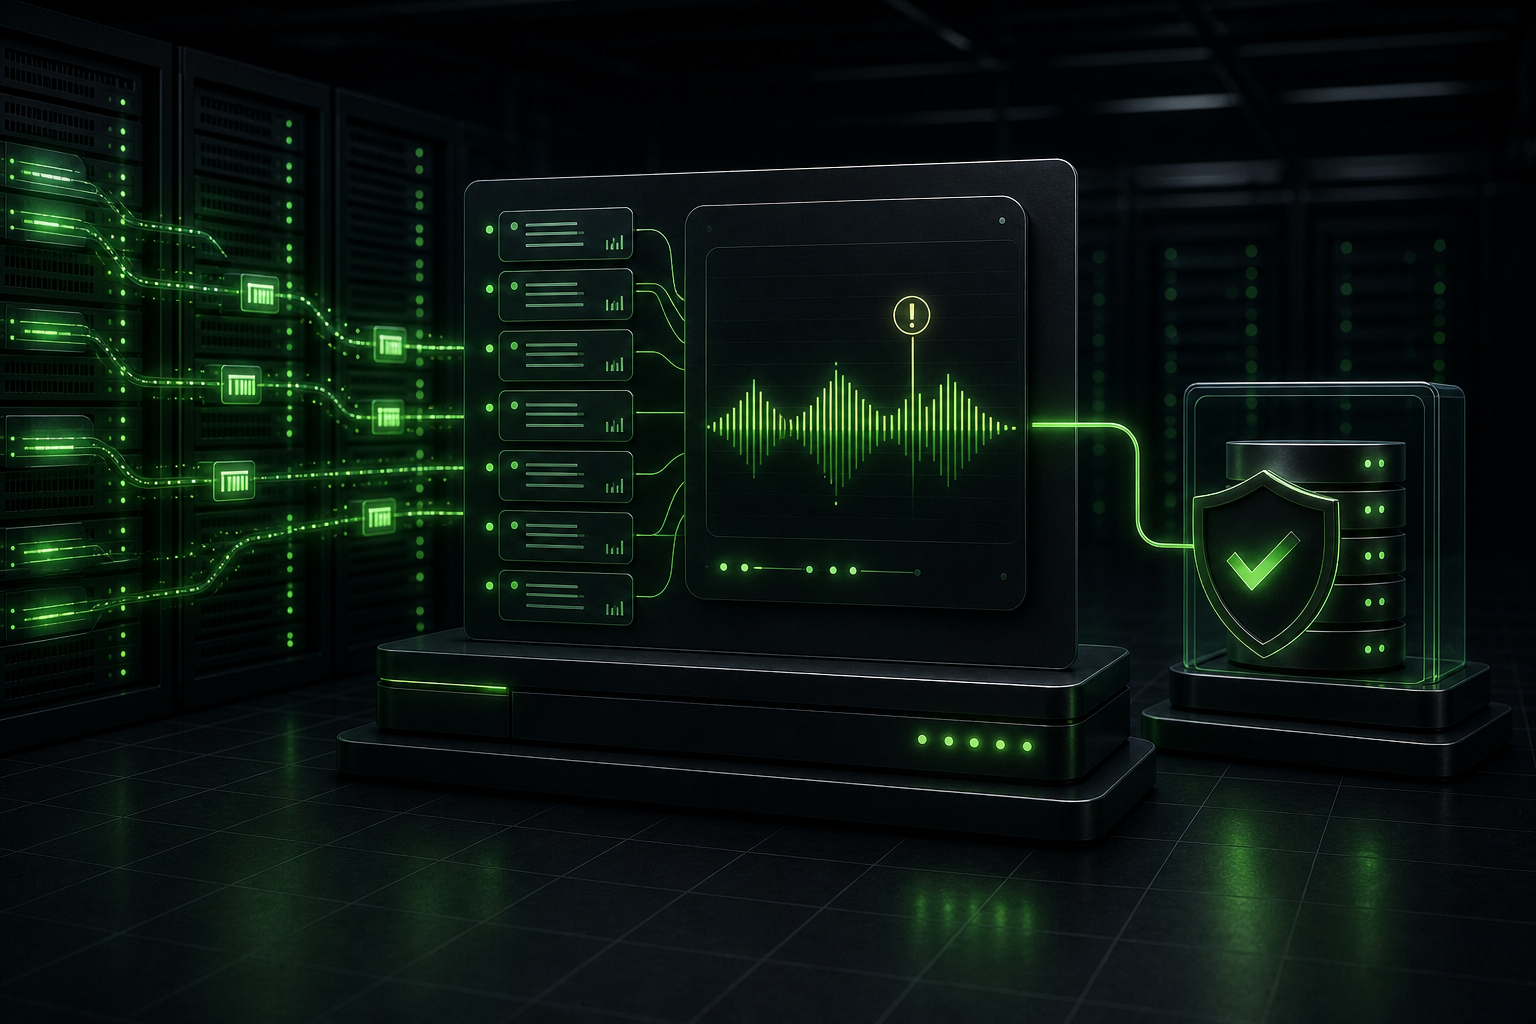
WordPress error log monitoring is one of the quietest ways to prevent a loud website failure. A site can look normal while PHP warnings repeat on every request, a scheduled job fails in the background, or a plugin records the same database error hundreds of times. Visitors may not notice today. However, the log often shows the pattern before a checkout, form, update, or admin screen finally stops working.
I do not treat a log as a file that only matters after a critical error. I use it as an early-warning record. The useful question is not, “Does this site have any errors?” Almost every active site produces some noise. The useful question is, “What changed, what keeps repeating, and which business path could this affect?”
This guide explains the routine we use during WordPress maintenance and technical support. It covers where to look, how to separate noise from risk, what should trigger an alert, and when an error needs development work instead of another plugin update.
Why error logs matter before a WordPress site looks broken
WordPress can recover from some failures. A plugin may catch an exception, a scheduled action may retry, or one request may fail while the next request succeeds. That resilience keeps the page online, but it can also hide a growing problem.
Repeated warnings can fill storage. Deprecated code can signal that a plugin will struggle after the next PHP or WordPress update. Database errors can point to a failing query or damaged table. Memory exhaustion may appear only during an import, backup, checkout calculation, or image task. A fatal error in a rare admin path may stay invisible until someone needs that exact screen.
Uptime monitoring cannot see all of this. A monitor can confirm that the homepage returned a successful response, yet it cannot prove that scheduled emails ran, a payment callback completed, or an editor saved a complex page. Logs provide the missing technical context.
What WordPress error log monitoring should include
A dependable routine checks more than one `debug.log` file. The exact locations depend on the host and stack, but the categories stay consistent.
- WordPress debug output: notices, warnings, deprecated calls, and fatal errors recorded while WordPress runs.
- PHP error logs: server-level PHP failures, memory exhaustion, timeouts, startup issues, and file errors.
- Web server logs: repeated 500 responses, blocked requests, upstream timeouts, and unusual request patterns.
- Application logs: WooCommerce, payment gateway, form, SMTP, backup, security, and integration records.
- Scheduled-task history: failed WP-Cron events, Action Scheduler jobs, queue backlogs, and retries.
The official WordPress debugging handbook explains how `WP_DEBUG`, `WP_DEBUG_LOG`, and `WP_DEBUG_DISPLAY` work. On a live site, errors should not appear to visitors. Logging also needs a deliberate storage and access plan because debug files can contain paths, query details, email addresses, request data, or other sensitive context.
Do not leave production debugging unmanaged
Turning on every debugging option and forgetting about it is not monitoring. It is a new operational risk. The file may grow without a limit. Sensitive details may sit in a public directory. A busy site may write enough entries to affect storage or performance.
When temporary WordPress debugging is necessary, define who will review it, when it will stop, where the file lives, and how it will be removed or rotated. Hosting-level PHP logging is often a better long-term source for production errors. The right setup depends on the server, but it should never rely on someone remembering to download a huge file months later.
A practical severity matrix for WordPress error monitoring
I rarely start by reading an entire log from top to bottom. First, I group entries by severity, frequency, time, and affected component. That turns a noisy file into a short investigation queue.
| Signal | Typical meaning | Response |
|---|---|---|
| New fatal error | A request or background task stopped completely | Check the affected path immediately and prepare rollback |
| Memory exhaustion or timeout | A task exceeded available resources or ran too long | Identify the task, input size, query, and recent change |
| Repeated database error | A query, table, connection, or data assumption is failing | Inspect frequency and confirm whether writes are being lost |
| Recurring warning | Code still runs but hits an invalid value, path, or assumption | Group duplicates and trace the responsible plugin or theme |
| Deprecated notice | Code uses behavior that may disappear in a future version | Track the owner and resolve before the next platform upgrade |
| One isolated notice | Possible edge case or harmless development noise | Record it, then watch for repetition or user impact |
Severity alone does not decide priority. One warning on every page view can matter more than one fatal error caused by a bot requesting a nonexistent file. Context changes the answer.
The first 15 minutes after a new WordPress error appears
An alert is useful only when the next person knows what to preserve and what not to change. During the first 15 minutes, the goal is not to make the log quiet. The goal is to connect the new signal to a user path while the original evidence still exists.
Start a short incident record with the first and latest timestamps, environment, request path or scheduled task, normalized message, component, recent change, and approximate frequency. Then choose the smallest safe test that can confirm or reject the suspected impact.
| New signal | Preserve first | Smallest safe test | Stop condition |
|---|---|---|---|
| Fatal error on a public request | Exact message, URL path, timestamp, request ID, and recent deployment or update | Open the same path once in a clean session and compare the newest server entry | Stop repeated testing if checkout, login, customer data, or a write action is involved |
| Payment, form, or webhook failure | Redacted order or submission ID, external event ID, response code, and delivery time | Compare the sender’s delivery record with the receiving WordPress log | Do not replay a live payment or webhook until duplicate handling is understood |
| Scheduled task or Action Scheduler failure | Hook name, arguments without private data, retry count, and previous successful run | Check whether the same queue is growing and whether its downstream action occurred | Do not bulk-run a backlog that could resend email, renew billing, or duplicate imports |
| Memory exhaustion or timeout | Memory limit, peak usage, task, input size, and query or plugin named in the trace | Repeat with the smallest representative input on staging or during a controlled window | Do not keep increasing limits when usage grows with every repeat |
| Rapidly repeating warning | One full example, unique count, first occurrence, latest occurrence, and affected template or endpoint | Compare one request with the same request before the latest change | Stop and rotate safely if log growth threatens disk space |
After the first test, classify the incident as confirmed user impact, likely background impact, development debt, or monitored noise. Record the evidence for that classification. A warning is not harmless merely because the page still loads, and a fatal entry is not automatically urgent when it came from a bot requesting an irrelevant path.
Close the incident only after the affected journey works and the same error no longer repeats under a representative test. If you cannot produce both proofs, keep the issue open with a named owner and the next review time.

The WordPress error log monitoring routine we use
Useful WordPress error log monitoring follows a repeatable sequence. The routine should be simple enough to run after an update and structured enough to compare with last month.
1. Record the normal baseline
Start when the site works. Note known recurring messages, normal queue volume, typical peak memory use, and expected scheduled jobs. A baseline prevents an old low-risk notice from distracting the team during a new incident.
Our monthly WordPress maintenance runbook treats this baseline as part of routine site care. Updates become much easier to assess when you know what the logs looked like before the maintenance window.
2. Mark every meaningful change
Keep a short timeline of plugin updates, theme edits, PHP changes, deployments, imports, traffic campaigns, and server configuration work. When a new error starts five minutes after a release, the timestamp provides a strong lead.
For custom work, use a controlled WordPress staging workflow before production. Staging will not reproduce every live condition, but it can expose syntax errors, deprecated calls, failed migrations, and obvious integration problems before visitors meet them.
3. Group duplicates before investigating
A log with 20,000 lines may contain only six unique problems. Group messages by error type, file, line, and a normalized message. Then count how often each group appears and when the first and latest events occurred.
This step reveals trends. A warning that appears twice after an admin save is different from the same warning on every public request. A fatal error that began immediately after a plugin update deserves a different response from an old bot-triggered request.
4. Reproduce the affected business path
Map the entry to a real action. Did it happen during checkout, a form submission, an API request, a backup, a cron event, or an editor save? Repeat the smallest safe test and watch whether the message returns.
WooCommerce sites need extra care because a successful page load does not prove the order flow. Use a WooCommerce checkout testing checklist and confirm payment, order creation, stock, email, and callback behavior when the log points near revenue-critical code.
5. Fix the cause, then prove the log stays quiet
Do not hide a warning with a broad suppression rule unless you fully understand the consequence. Update, configure, or repair the responsible code. Clear only the relevant old test data, repeat the affected action, and monitor the next normal traffic period.
A good fix has two proofs: the user journey works and the error stops recurring. Either proof on its own is incomplete.
Which log patterns deserve an alert
Sending an alert for every notice trains people to ignore alerts. Better rules look for changes and business impact.
- A new PHP fatal error appears after a deployment or update.
- The same warning crosses a frequency threshold within a short window.
- Memory exhaustion, maximum execution time, or database connection errors begin repeating.
- A payment, form, email, webhook, backup, or scheduled-job queue records failures.
- The error rate rises while 500 responses, slow requests, or failed user actions also increase.
- A log file grows unusually fast or approaches a storage limit.
Alert messages should include the site, environment, first occurrence, latest occurrence, count, component, and a safe excerpt. Avoid sending full request payloads or personal data into chat tools and email threads.
Common WordPress log monitoring mistakes
Checking only after a visitor reports the problem
By then, rotation may have removed the useful entries or the log may contain hours of follow-on noise. Regular review catches the first clean signal.
Assuming every warning is harmless
One warning may be harmless. Ten thousand copies can consume storage and hide a new failure. Repetition also tells you that active code keeps hitting an invalid condition.
Increasing memory without finding the task
A higher limit can help a legitimate workload, but it can also let an inefficient query or runaway process consume more resources. Find the operation, input, and code path first. The same principle applies when a slow WordPress admin points to background jobs or heavy database work.
Keeping one unlimited file forever
Logs need rotation, retention, access control, and enough history for comparison. Keep what helps investigation. Remove data that has outlived that purpose.
Clearing the log before recording the evidence
Capture the timestamp range, unique message, frequency, affected path, and recent changes before cleanup. Otherwise, the next person starts from zero when the error returns.
When WordPress error log monitoring turns into development work
Maintenance can resolve a stale plugin, failed cron event, storage problem, or configuration mistake. Development becomes necessary when the log points to custom code, a plugin conflict without a supported update, a broken integration, inefficient queries, or a migration that did not complete correctly.
Bring a developer in early when the error affects checkout, authentication, customer data, scheduled billing, or repeated server failures. The developer needs the exact message, timestamps, reproduction steps, environment details, and the change timeline. That evidence shortens diagnosis far more than a screenshot that says “critical error.”
Webless combines ongoing monitoring with hands-on WordPress development services when the repair crosses that boundary. The goal is not to keep applying temporary fixes. It is to remove the condition that keeps creating the error.
Questions site owners ask about WordPress error logs
Should WP_DEBUG stay enabled on a live site?
Visible debugging should not expose errors to visitors. Temporary logging can help an investigation, but it needs controlled storage, review, and a clear end time. Long-term production monitoring often belongs at the hosting, PHP, or application layer.
How often should someone review the logs?
Review them after every meaningful update or release, during a reported incident, and on a regular maintenance schedule. Critical stores and membership sites also benefit from automated alerts for fatal errors and failed business tasks.
Does a clean debug.log prove the site is healthy?
No. The site may log elsewhere, suppress an error, or fail in a service outside WordPress. Combine logs with uptime, functional tests, queue checks, performance monitoring, backups, and public-page verification.
Can a large error log slow down WordPress?
Heavy repeated writes and a file that consumes available storage can create real operational problems. The root issue still matters most: identify why the message repeats, then rotate or remove old data safely.
Turn WordPress error log monitoring into prevention
The best outcome is not a perfectly empty log. It is a site where new errors become visible, meaningful patterns reach the right person, and every repair gets verified against the affected user journey.
A practical WordPress error log monitoring routine gives maintenance work a memory. It connects a warning to a release, a failed job to a missing email, and a fatal error to the exact request that triggered it. That context lets the team act before a small technical signal becomes a public outage.
If nobody currently owns that routine, Webless can review the logging setup, define alert thresholds, and connect the findings to maintenance or development work. Start with a technical WordPress review, and we will focus on the signals that matter to the site rather than adding another dashboard nobody checks.