
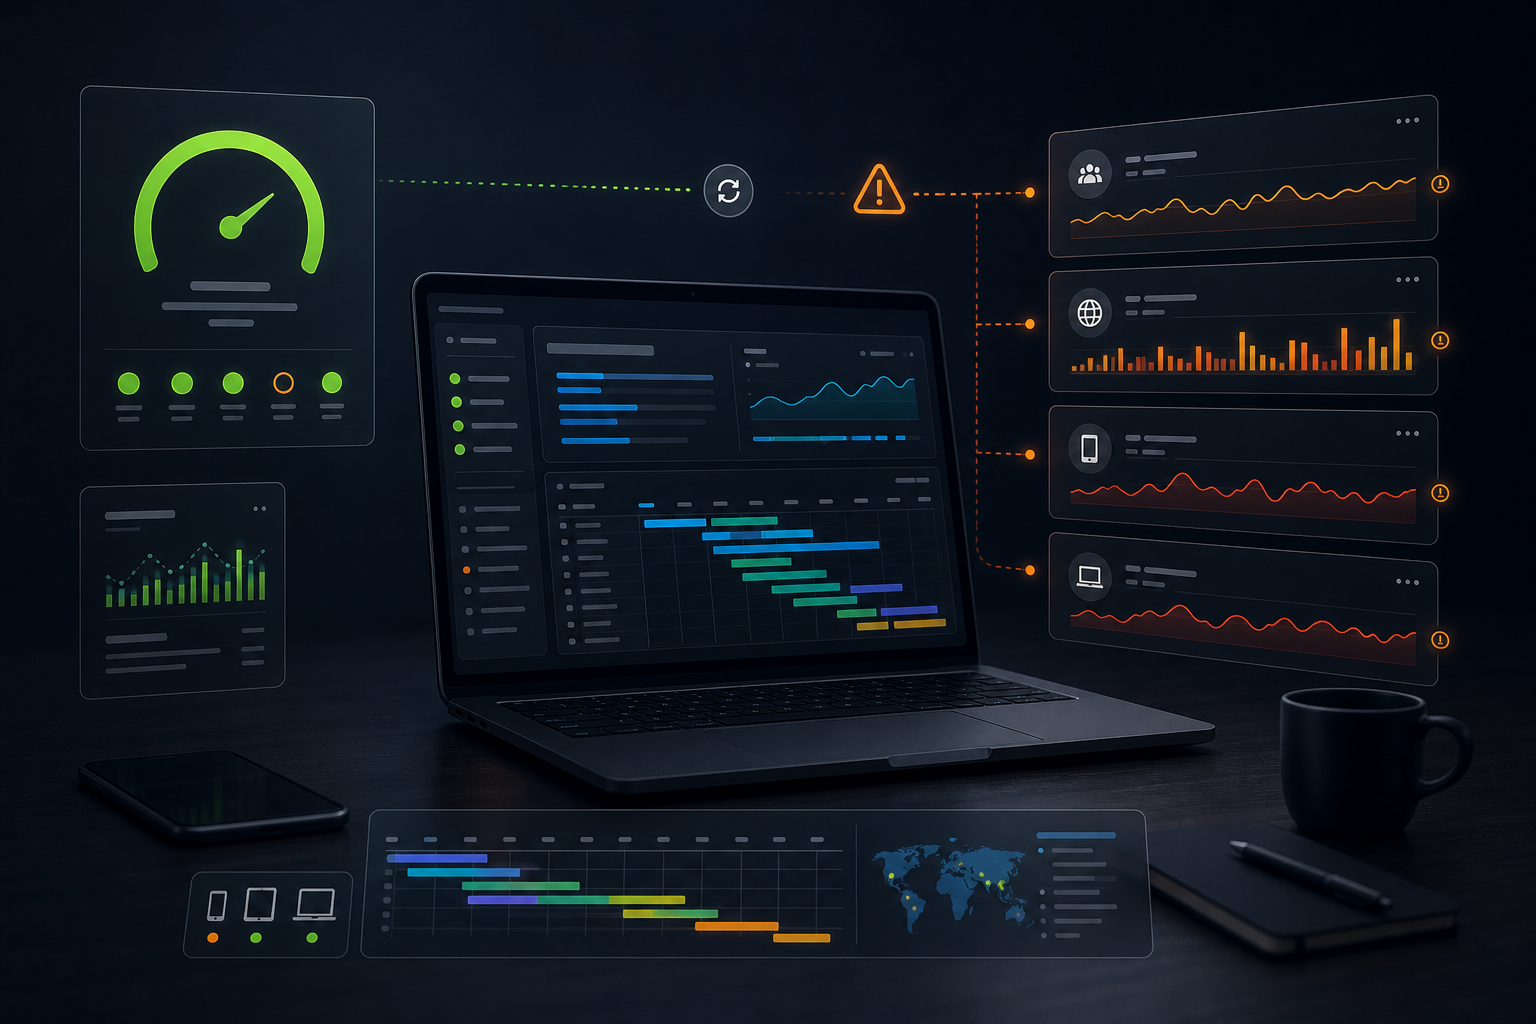
PageSpeed Insights vs Core Web Vitals can feel like a contradiction when one report says your WordPress site is fast and another says real users still have a poor experience. I see this a lot during speed audits: the homepage gets a green score in a fresh test, but Search Console keeps grouping important URLs as “needs improvement” for LCP, INP, or CLS.
The mismatch does not automatically mean the tools are wrong. It usually means they are answering different questions. A PageSpeed test is useful when you need a controlled diagnosis. Core Web Vitals field data is more useful when you want to know how visitors actually experienced the page over time.
That difference matters for WordPress SEO because it changes what you should fix first. If you chase the wrong number, you can spend hours changing cache settings, removing plugins, or rebuilding templates without moving the metric Google is actually reporting in Search Console.
Why PageSpeed Insights and Core Web Vitals do not always match
The short version is simple: PageSpeed Insights combines two types of performance evidence. It can show lab data from Lighthouse and field data from the Chrome User Experience Report when enough real-user data exists. Search Console Core Web Vitals reporting focuses on grouped field data over time.
Google’s documentation explains that Core Web Vitals measure real-world user experience for loading performance, interactivity, and visual stability. Those three areas line up with LCP, INP, and CLS. PageSpeed Insights can help debug those metrics, but its lab score is not the same thing as a Search Console field-data status.
This is where many WordPress site owners get stuck. They run a page once, see a strong score, and assume Search Console should clear the warning right away. Then nothing changes for days. The reason is usually not mysterious: Search Console needs enough fresh field data before the group changes status, and the field data reflects many visits, devices, networks, and page views.
The practical difference between lab data and field data
Lab data is a controlled test. It loads one URL under a defined test environment and records what happened during that run. That makes it very useful for debugging because you can repeat the test after changing image loading, JavaScript execution, caching, or server response time.
Field data comes from real visits. It includes fast laptops, old mobile phones, strong Wi-Fi, weak 4G, visitors from nearby regions, visitors from far away, returning users with a warm cache, and first-time users with no cached files at all. That makes it messier, but it also makes it closer to what people actually felt.
| Report area | What it is best for | What can mislead you |
|---|---|---|
| PageSpeed score | Quick technical direction and lab diagnostics | A green score can hide weak real-user data |
| Lighthouse lab metrics | Testing a fix before and after a change | One simulated run cannot represent every visitor |
| PageSpeed field data | Checking real-user performance for a URL or origin | Some URLs have too little data and fall back to origin data |
| Search Console Core Web Vitals | Seeing Google’s grouped field-data status over time | Grouping can make one weak template affect many URLs |
For a WordPress site, that last point is important. A blog post, service page, and WooCommerce category can share a header, font setup, cookie banner, analytics stack, and caching layer. If the shared template delays the largest element or blocks the first interaction, Search Console may group several URLs together even though one PageSpeed test looked fine.
Why a WordPress page can score well and still fail in Search Console
I usually look for five causes when PageSpeed Insights vs Core Web Vitals results disagree.
First, the tested page is not the same as the affected URL group. A homepage speed test tells you something about the homepage. It does not prove that every blog post, landing page, archive, product page, or Elementor template behaves the same way.
Second, cache state changes the result. A clean PageSpeed run after FlyingPress or Cloudflare has warmed the cache may look much better than a first uncached hit after a purge, plugin update, or page edit. Visitors can land during either state.
Third, field data has a delay. If you fixed the issue this morning, Search Console will not instantly rewrite its history. You need enough new visits and enough time before the report reflects the better experience.
Fourth, WordPress adds page-specific weight. One post might include a heavy hero image, several embeds, a form, a table of contents script, review widgets, or a video block. Another page might avoid all of those. A global score can miss this detail.
Fifth, user interaction is hard to reproduce in a simple lab run. INP problems often come from real taps, menu opens, form interactions, filter changes, or delayed scripts. A lab run can hint at main-thread pressure, but it may not show the exact interaction that frustrates a visitor.
This is why a serious speed audit should not stop at one green score. It should compare templates, check field data, inspect server timing, test uncached and cached states, and connect the numbers to what a visitor sees on the page.
What to trust when reports disagree
When a client asks which report to trust, my answer depends on the decision we need to make.
If we need to debug a technical cause, I trust the lab report enough to point us in the right direction. Lighthouse can show render-blocking CSS, unused JavaScript, oversized images, slow server response time, layout shift sources, and long main-thread work. That is exactly the kind of evidence a developer needs before touching a theme, plugin, or hosting setup.
If we need to understand SEO risk, I pay close attention to Search Console and field data. Those numbers show whether enough real users had a good experience. They also show whether Google sees the problem as isolated or grouped across a template.
If we need to decide what to fix first, I compare both. A low lab score with good field data can still be worth improving, especially on a commercial page, but it may not be the most urgent SEO issue. Poor field data with a decent lab score usually means we need to test more realistic devices, locations, templates, or cache states.
A Webless workflow for reading the mismatch
When Webless reviews a WordPress performance issue, I prefer a repeatable workflow instead of guessing from one tool.
Start with Search Console. I check which URL group has the problem, which metric is affected, and whether the issue is mobile, desktop, or both. A slow mobile LCP issue needs different work than a desktop CLS issue.
Open the affected page, not just the homepage. If the warning points to posts, I test posts. Product category warnings need product category tests. Service-page warnings need the actual service template.
Run PageSpeed Insights and read past the score. The top score is only a summary. The useful clues usually sit in the diagnostics: the LCP element, render delay, JavaScript execution, image delivery, unused CSS, third-party scripts, and server response time.
Compare cached and fresh views. A WordPress site can look fast after cache warmup and still feel slow during real editorial work, checkout, logged-in browsing, or cache rebuilds. That is why I like checking a clean URL and a harmless cache-busted version during QA.
Map the issue to a template or system. The fastest fix is rarely “install another performance plugin.” It is usually more specific: compress the hero image, preload the right font, reduce Elementor widget weight, delay a third-party script, fix a slow database query, or improve TTFB at the hosting/cache layer.
This approach also keeps the work honest. It avoids rewriting an entire site when one template needs care, and it avoids celebrating a green lab score when field data still shows a real visitor problem.
How to decide what to fix first
If the reports disagree, start with the metric that affects the user most clearly.
For LCP, inspect the largest visible element. On WordPress sites, it is often a hero image, featured image, heading block, slider, or background image. If the LCP element is an image, check the actual file size, dimensions, compression, preload behavior, lazy-loading settings, and CDN delivery. Our guide on how to fix LCP on WordPress goes deeper into that specific workflow.
For INP, look at JavaScript and interaction delay. Heavy page builders, cookie banners, tracking scripts, filters, popups, and chat widgets can all add friction. The fix might involve delaying scripts, removing unused widgets, simplifying interaction-heavy sections, or reducing main-thread work.
For CLS, watch the page as it loads. Layout shifts often come from missing image dimensions, late font swaps, banners injected above content, ads, embeds, or dynamic Elementor sections. CLS fixes are often small, but they require careful visual testing.
For TTFB, look beyond the browser. Server response time can come from slow hosting, uncached PHP, database bloat, object-cache misses, plugin overhead, or external API calls. If that is the issue, a front-end-only fix will not solve the root problem. Our post on slow server response time covers the diagnosis in more detail.
Where WordPress speed optimization fits in
A good WordPress speed optimization service should not promise one magic score. It should improve the parts of the site that actually slow users down: server timing, cache behavior, media delivery, CSS, JavaScript, font loading, layout stability, and template weight.
That is why I like using PageSpeed Insights vs Core Web Vitals as a conversation, not a fight between tools. PageSpeed gives clues. Search Console shows the longer-term SEO signal. Browser testing shows what the visitor experiences. WordPress admin and plugin checks reveal what can safely change without breaking the site.
The right fix often combines several small improvements. Compressing one image might help LCP. Removing one unused script might help INP. Setting explicit dimensions might fix CLS. Adding Redis object cache, improving hosting, or cleaning the database might reduce TTFB. None of those actions should happen blindly.
When to use a Core Web Vitals report
If you only have one page and one obvious issue, a manual review may be enough. If you have a business site with service pages, blog posts, landing pages, and Elementor templates, a structured report saves time.
Our Core Web Vitals report is designed for that situation. It looks at the affected templates, not just a single homepage score. It also connects each recommendation to the actual business risk: visibility, user experience, lead generation, and maintenance effort.
The report is especially useful when you see one of these patterns:
- Search Console reports poor URLs, but PageSpeed looks green.
- PageSpeed is poor, but the site owner cannot tell which fix matters.
- Different pages have different LCP elements and no shared diagnosis.
- INP problems appear only after users interact with menus, forms, or filters.
- Core Web Vitals improved once, then slipped again after plugins or content changed.
That last point matters for long-term SEO. Speed is not a one-time setting. WordPress changes every time you publish content, install a plugin, add tracking, update a builder, change hosting, or upload new media. Ongoing WordPress maintenance and support keeps those changes from slowly undoing the work.
The clean way to read PageSpeed Insights vs Core Web Vitals
Here is the rule I use: treat PageSpeed as the mechanic’s diagnostic screen and Core Web Vitals as the road test. You need both. One tells you where to look. The other tells you whether the site feels good for real people.
If your WordPress site has a green PageSpeed score but poor Core Web Vitals, do not panic. Check the affected URL group, the metric, the template, the cache state, and the actual user-facing element. Then fix the smallest real cause first.
If your PageSpeed score is low but Search Console looks fine, do not ignore it either. The lab report may reveal a fragile setup that will fail under heavier content, weaker devices, or future plugin changes. Use it as a warning before it becomes a field-data problem.
PageSpeed Insights vs Core Web Vitals is not about choosing one report and dismissing the other. It is about understanding what each report can prove. When you read them together, WordPress performance work becomes calmer, more precise, and much easier to connect to SEO results.
If you want a clear diagnosis instead of another round of plugin guessing, Webless can review the affected templates, explain what the reports are really saying, and turn the findings into a practical Core Web Vitals optimization plan.